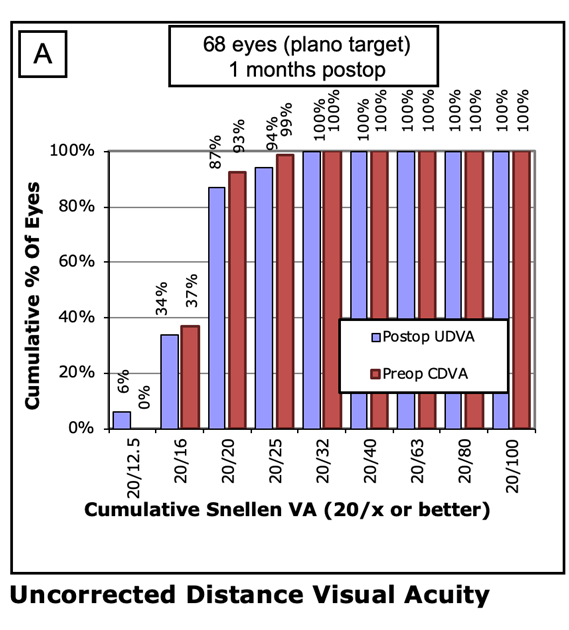
Efficacy Measure 1: Waring Graph A
This shows the proportions of ‘eyes’ that reach the different visual acuity thresholds – allowing an easy comparison between pre op ‘corrected’ vision and post op uncorrected visual acuity. This is a analysis of the Quarter September – December 2019
Perhaps most interesting here is that in this sample – no eyes had a super high acuity (20/12.5 equivalent to 6/4) PRE OP but 6% managed this level without correction POST OP!
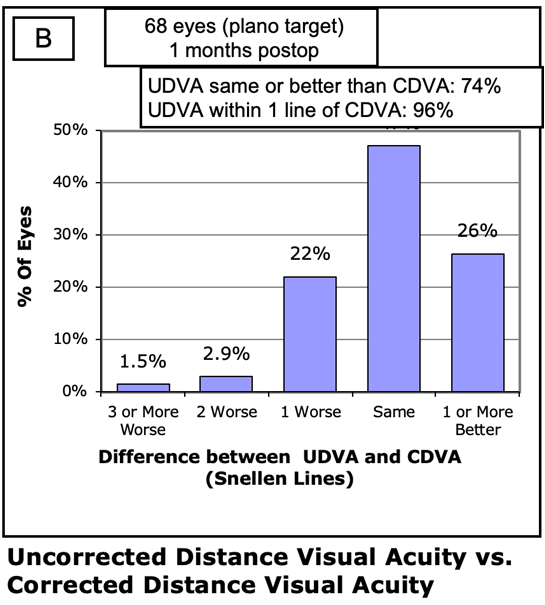
Efficacy measure 2: Waring Graph B
Here we use pre operative corrected (with glasses) visual acuity and compare how close to this a given eye achieves without any correction (glasses) post op. This is an analysis of the Quarter September – December 2019.
In this sample 74% of eyes have a visual acuity level which is at least the same level as their pre op best corrected level and in fact 96% are within 1 line of that vision level.
Each Eye treated with laser vision correction (all subtypes) has a:
Chance of having exactly the same or better, level of vision without glasses being required as they did prior to surgery with the full glasses correction on board
96/100 chance of being within 1 line on a distance chart of their pre operative corrected vision.
Surgical Success Rate
Surgical success is defined as ‘Completion of the intended surgical procedure without any intra-operative complications’ . The table below shows the results by procedure.
In summary just one minor complication occurred during a LASIK vision correction procedure which did not result in any vision problems for the eye in question. This gives a 99.7% rate of Laser vision correction surgery without ANY complications.
A single capsule complication out of 601 RLE/cataract surgeries gives an enviably LOW rate of capsule complication rate of 0.16%. This compares very favourably with UK eye surgeons’ average figures ranging from 1.92% (all grades) down to 1.0% for UK Consultant Eye Surgeons.
Surgical Success Rates
|
Number of procedures |
Percentage with NO INTRA-OP complication |
| Laser |
425 |
99.7% |
| Monofocal IOLs |
116 |
99.1% |
| Multifocal IOLs |
485 |
100% |
| ICL |
36 |
100% |
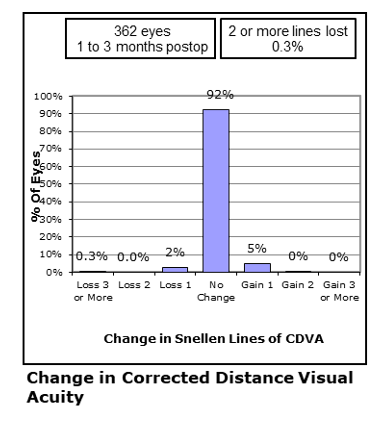
Safety Measure Waring Graph C
The way we assess the safety of a vision correction treatment is to compare pre operative best corrected vision with post operated corrected vision.
Internationally, a decline of 2 lines of best corrected vision is regarded as a noteworthy measure and most authorities regard procedures to be safe if the percentage of eyes that show 2 lines or more of decline is below 3%.
In this analysis of surgery during March 2019-March 2020 the rate was 0.3% or roughly ten times lower than the global benchmark.
BETTERSIGHT OUTCOMES
At Bettersight, my ethos when it comes to results is one of simple transparency. We believe individual surgeons results should be available for prospective patients to scrutinise and I am fully committed to adding further detail and data as it emerges so my patients can remain assured that my results are consistently of a very high standard.
In the interests of full transparency, the results presented below are the outcomes as independently assessed by highly experienced optometrists who are not in my personal employment. The results have been carefully collated by the Eye Sciences Department of Optegra Eye Hospitals who perform a very valuable function to sense check the raw data and help produce the data charts, tables & graphs detailed in this section.
As indicated It is my intention to regularly update the outcomes graphs on a regular basis so that my prospective patients can be confident that I and my team remain ‘on top their game!’.
The data presented below is from surgical activity with our key partners, Optegra Eye Hospitals across Yorkshire & Manchester between March 2019 to March 2020, with data collation in October 2020.
PS- If you have any ideas in regards to presentation of this data, especially from a lay persons perspective I would be delighted to hear from you – just contact me via the contact page.
Results of Laser Vision Correction
With Laser vision correction, whether it be LASIK, LASEK or SMILE – the agreed major outcome parameters are presented as a series of graphs, known as the Waring graphs, after George Waring III who back in 2000 & with a distinguished panel of refractive surgeons published the framework which allows a meaningful comparison of outcomes data (1). These six concise graphs focus on the major areas of most interest to us as surgeons but also to you the prospective patient. The four major areas are
Accuracy - How likely are we to meet our set refractive goals?
Efficacy - How effective is the treatment at producing a pre agreed level of visual acuity?
Safety – How safe are the treatments with respect to proportion of eyes that show even a slightly reduced level of corrected vision (that is vision with whatever small refractive error is present after surgery)
Stability – How stable are the results over time?
Some of the graphs shown below are from a more detailed analysis of surgery carried out in the last Quarter of 2019 and thus the number of eyes in the treated range are smaller but the results remain indicative.
1) Waring GO, 3rd. Standard graphs for reporting refractive surgery. J Refract Surg. 2000;16(4):459-466. Erratum in: J Refract Surg. 2001;2017:following table of contents.
Laser Vision Correction Outcomes
For Laser vision correction. The major visual acuity thresholds are achieving uncorrected distance vision acuity of 6/12 (20/40) or better and 6/6 (20/20) or better PER EYE. Please remember many companies report their 6/12 and 6/6 outcome rates PER PATIENT ie with two eyes corrected and not as in this more detailed analysis PER EYE.
The major refractive outcome we analyse, is the percentage of eyes treated that get to a refraction of within ±1.00 Dioptres of the intended target and the percentage of eyes treated that get to a refraction of within ±0.50 Dioptres of the intended target.
We comfortably exceed the UK & Global Benchmark stats (3) for each of these four major outcome measures.
Furthermore this is a whole of practice analysis so we have not weeded out the more complex prescriptions – the high prescriptions, the high astigmatism eyes and the long sighted (hyperopic) eyes which we know tend to be less likely to meet these targets. Many companies will present data on only the group of cases which are known to have the very best outcomes – the low to moderate myopic eyes.
Laser Vision Correction Outcomes
| Number (%) of Eyes achieving 6/12 or better ‘unaided’ (Benchmark 96%3) |
Number (%) of Eyes achieving 6/6 or better ‘unaided’ (Benchmark 58%3) |
Number (%) of Eyes within +/-1.00 of PPOR (Benchmark 93%3) |
Number (%) of Eyes within +/-0.50 of PPOR (Benchmark 73%3) |
| 356/362 |
98% |
305/362 |
84% |
345/362 |
95% |
290/362 |
80% |
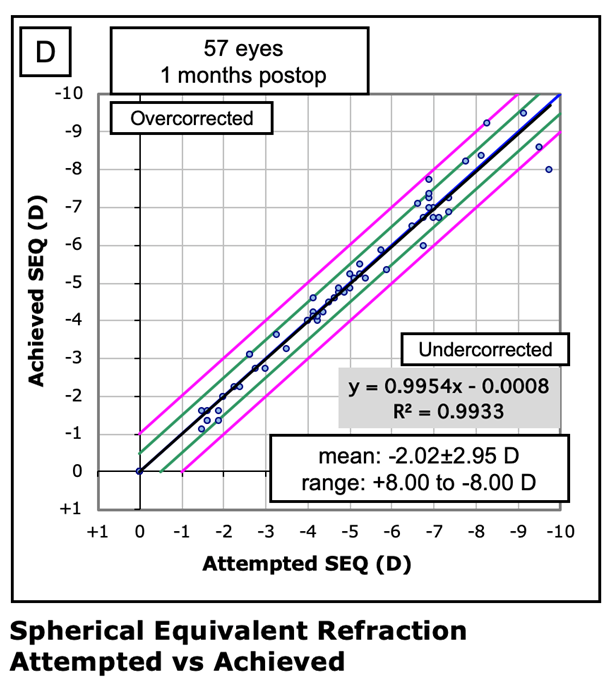
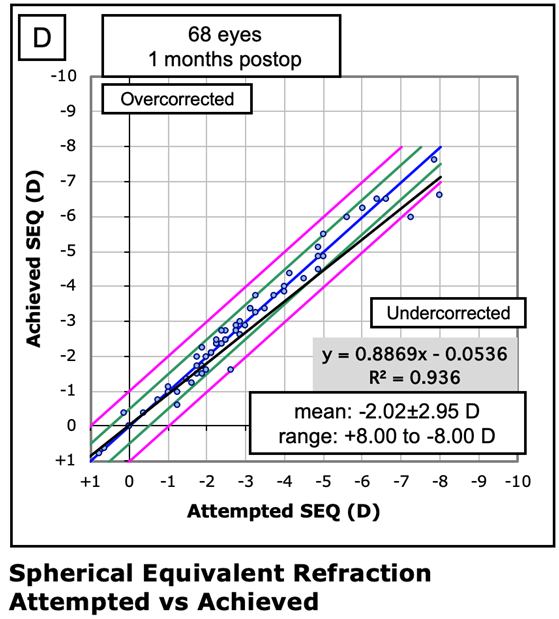
Waring Graph D : Accuracy Measure
This scattergraph plots on the x axis the attempted refractive correction and on the Y axis the achieved refractive outcome. The measure used in this chart is called spherical equivalent and is a numerical composite of the SPHERE and CYLINDER. Spherical equivalent is essentially the average refractive prescription for a given eye and is calculated as follows SE=(Sphere)+(0.5xCYL).
The line of perfect outcome is denoted by the central dark blue line, The two green lines either side indicate an outcome of within ±0.5D SE of the intended correction. The outer pink lines denote and outcome within ±1.00D SE of the intended correction. What this also demonstrates is the slightly higher accuracy of outcome in the low to mid range of myopic prescriptions. One of the reasons why higher prescriptions are in many clinics charged more for their treatment is the slightly higher chance of requiring a further enhancement procedure in the higher prescription ranges.
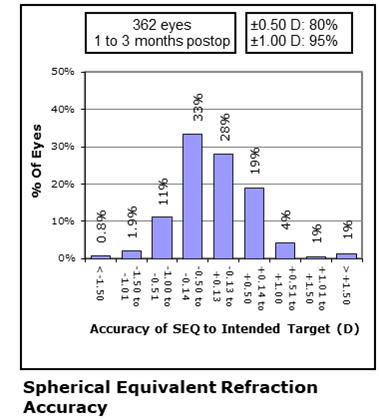
Accuracy Measure: Waring Graph E
The way we assess the accuracy of a vision correction treatment is to analyse the percentage of eyes getting to within 1.00 Dioptres and 0.50 Dioptres of the intended refractive target.
As a guide, ±1.00 D outcome should be met in over 90% of eyes treated and the ±0.50D outcome should be met in over 70% of treated eyes.
The results here are excellent with 95% meeting ±1.00D and 80% meeting ±0.50D.
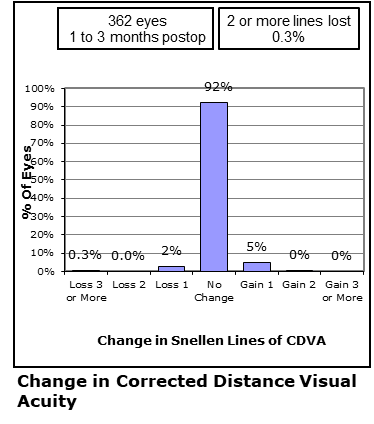
Safety Measure Waring Graph C
The way we assess the safety of a vision correction treatment is to compare pre operative best corrected vision with post operated corrected vision.
Internationally, a decline of 2 lines of best corrected vision is regarded as a noteworthy measure and most authorities regard procedures to be safe if the percentage of eyes that show 2 lines or more of decline is below 3%.
In this analysis of surgery during March 2019-March 2020 the rate was 0.3% or roughly ten times lower than the global benchmark.
Patient Reported Outcome Measures
Whilst objective outcomes data is critical and as professionals we scrutinise the data very regularly to ensure that our treatments are meeting or exceeding international standards, we never lose sight of the simple fact that in the end – the patients perception of their treatment, how it was carried out, how satisfied they may or may not be and how likely they may be to recommend the treatment (and by inference the clinic and surgeon) to their family and friends is just as important.
We work hard to collect and collate what are today known as patient reported outcome measures (PROMS). This is something that at Bettersight and under Mr. Rehmans’ guidance we are seeking ways to improve the interface through which such data is collected – one of the major developments recently is Mr Rehmans’ development of a patient support app which is designed not only to help patients manage their post-operative eye-drop regimes but also acts as an interface between the patient and their clinic and surgeon – but will we hope play an important role in collecting feedback data from as many of our patients as possible.
Data on patient satisfaction with clinical outcomes are being collated using tablet-based questionnaires. This is providing further insight into the outcomes of procedures carried out at our clinics. Tables below show total number of respondents for each statement and the percentage of respondents who ‘agreed’ or ‘strongly agreed’ by procedure. These tables cover the period to the end of March 2020.
References
1.Sandoval HP, Donnenfeld ED, Kohnen T, et al. Modern laser in situ keratomileusis outcomes. J Cataract Refract Surg. 2016;42(8):1224-1234.
2.Day AC et al. The Royal College of Ophthalmologists’ National Ophthalmology Database study of cataract surgery: report 1, visual outcomes and complications. Eye; 2015: 29, 552-60
3.Lundstrom M et al. Risk factors for refractive error after cataract surgery: Analysis of 282 811 cataract extractions reported to the European Registry of Quality Outcomes for cataract and refractive surgery. J Cataract Refract Surg; 2018: 44, 447-52
4.National Ophthalmology Database Audit 2019. Annual Report. wwwrcophth
Patient reported Outcome measures for Laser Vision Correction
The results of the (N=183) laser vision correction respondents to complete the survey over the past 4 quarters indicate that over 99% of patients are satisfied with their outcomes and would recommend the procedure to family and friends.
Patient reported Outcome measures for Laser Vision Correction
| Agree or Strongly Agree |
Mr Rehman 183 responses |
| “My treatment has been successful” |
100% |
| “I am satisfied with my treatment” |
100% |
| “I would recommend this treatment to family & friends” |
100% |
Patient reported outcome measures for RLE
Data on patient satisfaction with RLE outcomes are also collated using tablet or app based questionnaires. The results of the 91 RLE respondents to complete the survey over the past 4 quarters indicate that 97% of patients are satisfied with their treatment and 98% would recommend the procedure to family and if they needed it.
Patient reported outcome measures for RLE
| ‘Agree or Strongly Agreed’ |
Mr Rehman 91 Responses |
| “Im satisfied with my distance vision after treatment” |
100% |
| “I am satisfied with my near vision after my treatment” |
95% |
| “I am satisfied with my mid range vision (vdu, car dashboard etc)” |
98% |
| “I am free from the need to use spectacles |
87% |
| “I am free from troublesome symptoms of glare & halo” |
45% |
| “I am satisfied with the results of my treatment” |
97% |
| “I would recommend this treatment to family & friends” |
98% |
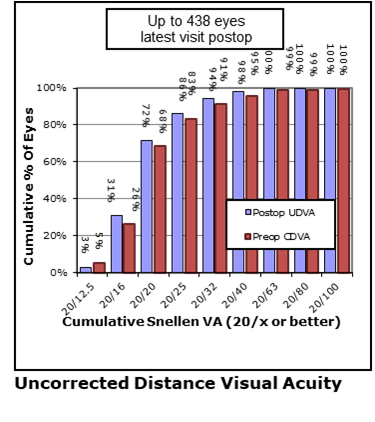
Uncorrected Distance Vision Outcomes in RLE
This chart shows the cumulative results of a large cohort of 438 eyes treated as RLE during the year ending March 2020.
6/12 (20/40) unaided vision seen in 98% of treated eyes.
6/9 (20/32) – Driving standard acuity was seen in 94% of treated eyes post op without correction which was 3% more than the equivalent standard pre op even with FULL CORRECTION with glasses etc.
6/6 (20/20) – Normal human eyesight standard was seen in 72% of treated eyes and compares favourably with the 68% of eyes meeting this standard at pre op (with FULL CORRECTION).
6/5 (20/16) – Better than normal human eyesight standard seen PRE-OP in 26% of eyes but this figure rose to 31% of treated eyes post op even without correction on board.
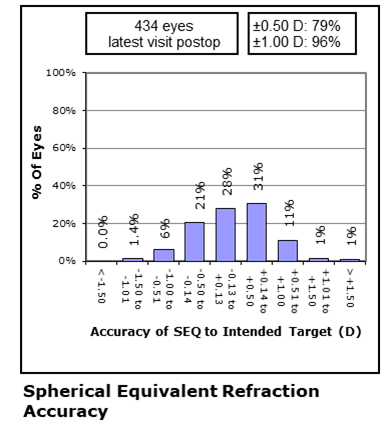
Refractive Outcomes after RLE
This graph details the range of refractive outcomes achieved in RLE surgery in my practice during year ending March 2020.
Just a point to make about RLE, this is often being done in people with very high prescriptions – so this undoubtedly presents an additional ‘headwind’ in attaining very high refractive accuracy. Despite this however we can see that we are still exceeding national UK surgery benchmarks.

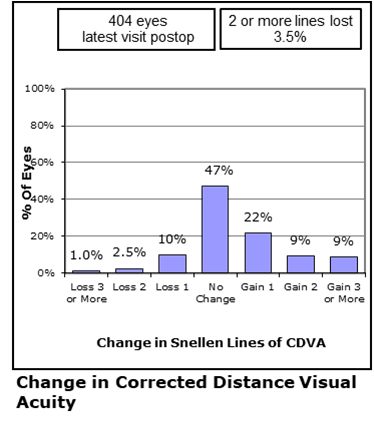
Change in Corrected Visual Acuity after RLE.
Some important points to help understand this graph. Many of the RLE patients I treat will opt for Multifocal or Extended focus lens implants. These implants by way of their physical properties are known to have a slight detriment to corrected distance vision in order to create a strong Near or Intermediate visual focus. In other words a small trade off is something that we counsel patients about before they opt for Multifocal or Extended focus IOL’s.
Having said this, please note that on the positive side, up-to 9% of eyes GAINED 3 lines of vision that they previously were unable to see in that eye even with their full glasses correction on board pre op.
Its worth knowing that in this data analysis a given eye was approximately 9 times more likely to gain 3 lines of visual acuity than to lose 3 lines of visual acuity.
Refractive Lens Exchange
We can use the same framework established for Laser vision correction outcomes by drawing up the Waring Graphs for RLE.
Once again the major outcomes measures are:
Proportion of eyes reaching unaided 6/12 and 6/6 visual acuity post op
Proportion of eyes attaining a refractive outcome that is either within ±1.00 Dioptres or ±0.50 Dioptres.
Change in corrected visual acuity pre op v post op as a measure of safety
SMILE Laser Vision Correction
SMILE – Is the THIRD generation of Laser Vision Correction surgery, the agreed major outcome parameters are presented in exactly the same Waring graphs as we do for LASIK or LASEK. These graphs focus on the major areas of most interest to us as surgeons but also to you the prospective patient. The four major areas are
Accuracy - How likely are we to meet our set refractive goals?
Efficacy - How effective is the treatment at producing a pre agreed level of visual acuity?
Safety – How safe are the treatments with respect to proportion of eyes that show even a slightly reduced level of corrected vision (that is vision with whatever small refractive error is present after surgery)
Stability – How stable are the results over time?
With SMILE being a procedure that has been available in various parts of the world for over 10 years now, the global experience has grown rapidly in the past few years, in fact its thought that close to 3 million treatments have been performed worldwide for SMILE – still the only Keyhole style of Laser vision correction surgery available as of October 2020.
Stability – How stable are the results over time?
SMILE : Uncorrected Post op Distance Visual Acuity
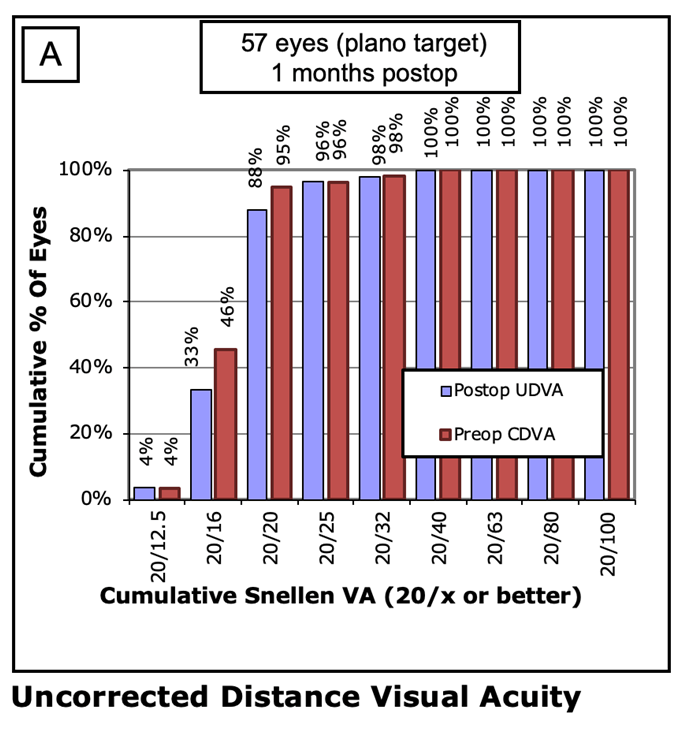
In this recent analysis of SMILE outcomes in people with a wide range of prescriptions, many of them high prescriptions we see that:
88% of eyes attained a vision of 6/6 (20/20) uncorrected post op
98% of eyes attained a vision of 6/9 (20/32) (Driving standard) post op.
100% attained a vision of 6/12 (20/40) post op.
The results compare very favourably with LASIK.
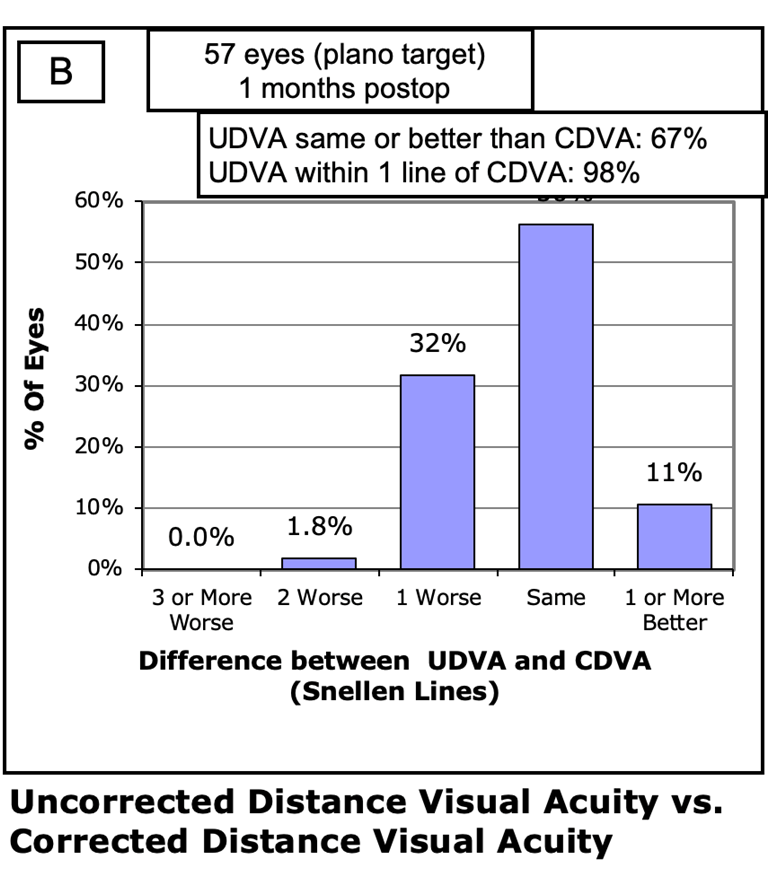
SMILE : Uncorrected Post op Distance Visual Acuity
67% of eyes treated with SMILE during the last quarter of 2019, attained a distance uncorrected visual acuity that was the same or better than the pre op distance Corrected visual acuity for that eye.
98% of treated eyes were within 1 line of their pre operative best corrected acuity.
These outcomes compare very well to LASIK.
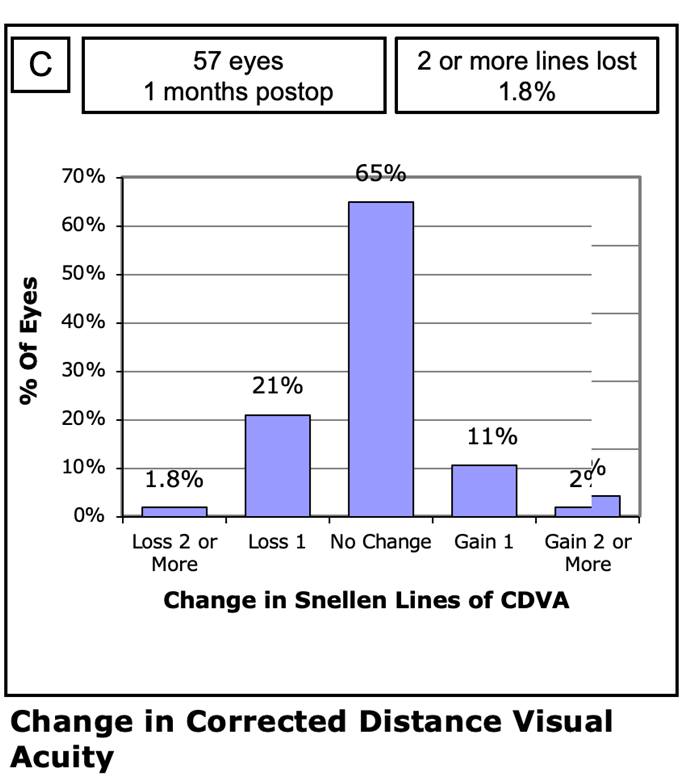
SMILE : Change in Post op Distance Corrected Visual Acuity
98.2% of eyes Do NOT SHOW a decline of 2 or more lines of Visual acuity when comparing pre operative Best corrected with Post operative Best corrected visual acuity.
11% show an actual GAIN of 1 line of visual acuity in this analysis. In other words corrected vision that exceeded the eye’s maximum potential pre op.
SMILE : Refractive Outcomes Plot
One of the interesting things that differentiates SMILE from Excimer laser procedures such as LASIK or LASEK, is that the corrective element of the SMILE laser procedure is performed whilst the eye is gently held under a contact device. This means that the ‘business end’ of the treatment is done whilst your eye is kept very still and under control.
One of the effects of this is we do seem to see less deviation of refractive outcomes as we carry out larger prescription treatments. This is nicely demonstrated in this chart which shows the vast majority of the individual eye outcomes are centered around the line of perfect outcome (the solid blue line.
In this plot out of 57 eyes where results were available, only 1 eye was slightly outside the ±1.00 D line (the outside pink lines).